


From finding out audience interest to calculating market interactions, data analytics are the in-thing. Uma finds out how.
The entire world has been talking about Data and the importance of Data and Privacy. There are systems being developed, cloud networks being built, to manage the amount of data and the magnitude of information being stored, processed, and analyzed.
The key to any data is the ability to access, breakdown and process the information to support the transaction it serves.
When we were in the 1990s and computers were becoming a household utility, there was a saying in programming called ‘Garbage In, Garbage out!’. Today that saying has now been rendered as obsolete by Artificial Intelligence (AI). Nothing is ‘Garbage’ when it comes to data. All data can be used if it can be indexed to fetch and made usable.
Indexing
Formula 1 would be uninteresting if there was no starting point and every car started in different starting points. What is intriguing is that the enthusiasts can measure the speed or pitstop times or the capability of a driver based on who reaches first. If all races started at varied timings, it would be difficult to gauge a winner.
The same applies to data. To compare data and put things in context, indexing is used. It enables data comparison irrespective of its magnitude. If there were a million cars racing the F1 track, the starting point would help determine the relative success of the timings of the car in comparison to other cars.

A database index is a data structure that improves the speed of data retrieval operations on a database table at the cost of additional changes and storage space to maintain the index data structure. Indexes are used to quickly locate data without having to search every row in a database table every time a database table is accessed.
To speed up the data retrieval in a data set, indexes are set on each data element, to quickly locate the data without having to search every row. Indexes can be created on any number of data sets and assigned to ensure that it can be efficiently accessed.
With data being so scattered across the industry and organization, it is difficult and time consuming to analyze data. There is a lot of impetus on data gathering and data analytics in the industry today. There are three types of analytics: Predictive, Prescriptive and Diagnostic.
Predictive Analytics: Whether someone will read this article or not and drafting the article in view of the demographic this article will target is to aid predictive analytics.
Prescriptive Analytics: Trying to put different variables and employing machine learning and determining the ‘What if?’ is prescriptive analytics.
Diagnostic Analysis: This one is particularly powerful for reporting. Business Intelligence tools and dashboards give a view of what, how much and how many over time.
You may be swamped with data, but you are not swamped with relevant data. Even in a huge database, there is often only a small amount of it that is relevant – Michael Jordan, Berkeley Research
Source: Inoxoft
Data is not just numbers
It becomes quite easy when we have a one-to-one interaction with our customers or if there is a finite number of customers. But to use social media where your target consumers are varied and requirements are not consistent, use of data analytics becomes a primary go-to source to launch a website or a product. However, it is not just the numbers that determine the results.
Data is just viewed as numbers and number crunching, but it is more than that. It is the unseen web that determine the ultimate success of a product in the market. Typically, viral videos are not always premeditated. There are unknown numbers that are also that play that the markets must be wary about. Especially, for a product placement usage of social media stars with millions of followers are employed as brand ambassadors. However, the video that got them the millions of users may or may not be the target audience for the product
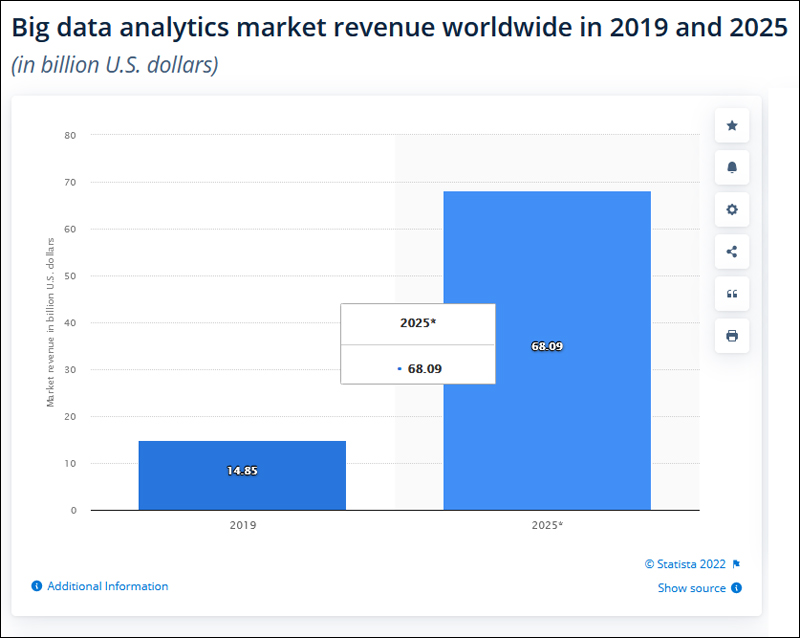
“The global big data analytics market will grow with a compound annual growth rate of almost 30 percent in the coming years, with revenue reaching over 68 billion U.S. dollars by 2025 from around 15 billion U.S. dollars in 2019.”
Source: Statista
The unspoken and unquantifiable data
While the numbers give a good starting point, human nature and demographics do work mystically. There are a lot of numbers that are hidden in ‘WhatsApp shares’ and ‘Facebook account shares’ that enhance the product requirement.
The timing of the release, the relevance, and the general feel-good factor that the stars work with have an unspoken and unquantifiable data that helps a products success.
There is chaos in numbers and data analytics is catching up with complex models to demystify the human patterns.
It is a good space to be that we do not know everything, it means we are learning, and we are moving!
In case you missed:
- None Found


